Best AI SRE tools: what each one watches, finds, and fixes
Published
Summary
An AI SRE investigates production problems for you. We compared 13 AI SRE tools, including Superlog, Resolve AI, Cleric, and Datadog Bits, on what they watch, what they output, pricing, and self-hosting.
An AI SRE is an agent that reads production signals, works out what broke and why, and hands back a finding, an incident update, or a fix. The tools sold under that name differ mostly in two ways: where they start (raw logs, an alert, an incident, or a bug report) and what they hand back (a message in Slack, a root cause analysis, or a pull request).
This guide compares 13 AI SRE tools on those two points, plus who acts on the output, what each costs, and whether you can run it yourself. Every claim about a vendor links to that vendor's own page. We checked them all on November 13, 2026.
How we researched and tested
An AI agent working in a Replicas workspace read each vendor's homepage, docs, pricing, and security pages, and a person on our team reviewed this guide before it was published. We dropped tools we couldn't source from their own pages. Where a vendor's pages don't say something, the table says "Not published".
We didn't run the other products. We did run one Replicas automation in our own organization, from a real error alert to a fix pull request, on a scratch repository with no customer data. That run is described below.
Replicas is our product. Superlog is a partner of ours, and we asked them to check how we describe them.
What AI SRE tools do
Most tools in this category do one or two of four jobs:
- Find problems no alert caught. Read logs or watch changes continuously and report what looks wrong.
- Investigate an alert. Start from an alert or error, pull in logs, metrics, traces, recent deploys and code, and name a likely root cause.
- Run the incident. Open the channel, page people, post status updates, and write the postmortem.
- Change code. Propose a fix or open a pull request.
Which jobs each AI SRE tool does
Tool
Finds problems no alert caught
Investigates an alert
Runs the incident
Changes code
Superlog
Scans production logs
Core job
Investigates what it finds
Not its job
Suggests a fix
Sazabi
Log-first AI observability
Core job
Root cause per issue
Not its job
Fix plan for engineers or agents
Cleric
Checks production changes
Checks every change you ship
Core job
Not its job
Fix PR for your approval
Traversal
Enterprise RCA
Detects incidents
Core job
Post-mortems
Remediation, PRs not documented
Causely
Causal reasoning engine
Continuous diagnosis
Core job
Hands off to incident tools
Guidance, one-click scaling
Resolve AI
Alert investigation agent
Starts from alerts
Core job
Joins incidents in chat
PRs after approval
NeuBird
Production ops agent
Starts from alerts
Core job
Not its job
Staged fix, after approval
Komodor
Kubernetes operations
Starts from alerts
Core job
Incident view and postmortem
Staged fix or PR, after approval
Datadog Bits
Inside Datadog
Starts from monitors
Core job
Opens incidents, pages on-call
PRs through Bits Code
incident.io
Incident platform
Starts from incidents
Investigations add-on
Core job
A PR you merge
Rootly
Incident platform
Starts from alerts
AI SRE product
Core job
Draft PRs
PagerDuty
On-call and incident platform
Groups alerts
Paige SRE agent
Core job
Runs approved remediation
Replicas
Cloud coding agents
Acts on alerts you send it
Agent reads code, logs, and tools
Not its job
Opens the fix PR
Few tools do all four. Log-first tools such as Superlog and Sazabi are built to find problems nobody alerted on. Incident platforms such as incident.io, Rootly, and PagerDuty already run incidents and have added investigation agents. Most tools in the table now propose code changes, and every one that opens pull requests leaves the merge to a person.
AI SRE tools compared
Superlog is listed first, then the rest in alphabetical order. This isn't a ranking. Prices are list prices from each vendor's pricing page.
| Tool | What it watches | What it outputs | Who acts on it | Pricing or plan | Self-host |
|---|---|---|---|---|---|
| Superlog | Production logs and telemetry, from OpenTelemetry, Sentry, Datadog, Grafana, AWS CloudWatch, and Google Cloud, plus the GitHub repositories you choose (Superlog) | A finding in Slack with the impact, root cause, evidence, and a suggested fix when there is one (Superlog) | Your team, from the finding in Slack (Superlog) | Pro $100 a month for up to 50 findings, Max $200 for up to 100. Only posted findings count (Superlog) | Yes. Open source under Apache 2.0, or hosted in the EU or US (Superlog) |
| Causely | Telemetry and alerts from OpenTelemetry, Prometheus, Datadog, and eBPF, across Kubernetes, ECS, and VMs (Causely) | Root cause, blast radius, and owner, with remediation guidance (Causely) | Your agents or automations. Scaling fixes can run in one click (Causely) | Professional $2,000 a month for up to 500 services. Enterprise custom (Causely) | Bring your own cloud. On-prem and air-gapped on Enterprise (Causely) |
| Cleric | Every production change, plus alerts from Datadog, Grafana, Sentry, PagerDuty, Kubernetes, and others (Cleric) | The cause, the evidence, and a fix PR (Cleric) | You approve the PR. Cleric doesn't merge (Cleric) | Team $700 a month, Pro $1,500, Scale $3,000. Enterprise custom (Cleric) | No. Single-tenant SaaS in the US or EU (Cleric) |
| Datadog Bits Investigation (formerly Bits AI SRE) | Datadog metrics, traces, logs, RUM, and error tracking. Grafana, Sentry, and Splunk in preview (Datadog) | A conclusion with evidence, and a suggested code fix or PR (Datadog) | Admins set what needs approval. You merge PRs (Datadog) | From $500 for 500 AI credits a month, billed annually. About 4 credits per investigation (Datadog) | No |
| incident.io Investigations | Datadog, Grafana, GitHub, Slack, and tools exposed through MCP (incident.io) | A root cause with a confidence score and evidence, posted in the incident channel (incident.io) | You. Its only change to your systems is a PR you merge (incident.io) | Add-on to Pro and Enterprise. Price not published (incident.io) | No. A proxy in your network can reach private data sources |
| Komodor | Kubernetes, with alerts from Datadog, Grafana, AlertManager, PagerDuty, and OpsGenie (Komodor) | One incident per group of alerts, a root cause with evidence, and a staged fix or PR (Komodor) | A person approves every production change (Komodor) | Custom pricing (Komodor) | Agents in your cluster. Self-hosted control plane in beta (Komodor) |
| NeuBird | Metrics, logs, traces, alerts, tickets, and code, through Datadog, Splunk, CloudWatch, Grafana, and PagerDuty (NeuBird) | A root cause with evidence and a staged fix, in Slack, Teams, or the web app (NeuBird) | A person approves high-risk actions (NeuBird) | Credits per run, with a 50-credit free trial. Enterprise custom (NeuBird) | Yes, in your VPC on Pro and Enterprise (NeuBird) |
| PagerDuty Paige (SRE agent) | Change events, logs from Grafana, Datadog, New Relic, and CloudWatch, and code in GitHub (PagerDuty) | Likely root cause, recommended remediation, and post-incident reviews (PagerDuty) | You approve each fix, unless you let Paige act alone (PagerDuty) | In the PD Reliability Platform, from $2,800 a year (PagerDuty) | No. A runner reaches systems behind your firewall |
| Replicas | Whatever starts it: a Sentry issue or alert, a Slack message, a Linear issue, or a custom webhook (Replicas). Agents can query Datadog, Grafana, PagerDuty, and Sazabi through plugins (Replicas) | A pull request with the fix and an explanation, from a coding agent in its own cloud VM | You review and merge the PR | Billed per workspace minute, with $100 of free usage. Models are billed by your provider (Replicas) | Self-hosted and dedicated deployments on a custom Enterprise contract (Replicas) |
| Resolve AI | Code, infrastructure, telemetry, and docs, including Kubernetes, Datadog, Grafana, and Splunk (Resolve AI) | A root-cause hypothesis, a timeline, proposed fixes, PRs, and Jira updates (Resolve AI) | PRs and alert silences need your approval (Resolve AI) | Credit-based. Price not published (Resolve AI) | A container agent can run in your clusters (Resolve AI) |
| Rootly AI SRE | Code changes, telemetry, and past incidents, through Sentry, Datadog, Grafana, GitHub, and AWS (Rootly) | A probable root cause with evidence, remediation steps, and draft PRs (Rootly) | A person signs off on every change (Rootly) | Requires Incident Response. Included in Enterprise. Price not published (Rootly) | No. A private agent in your network is in early preview |
| Sazabi | Production logs, and your code (Sazabi) | An issue with its root cause and a plan to fix it, in Slack, Teams, or email (Sazabi) | Your engineers or coding agents (Sazabi) | $50, $200, or $1,000 per 30 days. Enterprise custom (Sazabi) | Log processing can run in your AWS account, on an annual agreement (Sazabi) |
| Traversal | Metrics, logs, traces, and alerts, through Datadog, Grafana, Splunk, and Kubernetes (Traversal) | Root cause summaries in Slack, timelines, and postmortems (Traversal) | Not published. Traversal describes "automated remediation" (Traversal) | Price not published (Traversal) | Bring your own cloud and model (Traversal) |
What the table shows
Log-first tools: Superlog and Sazabi. Superlog reads logs as they arrive and picks out "errors, failures, and odd patterns, including the ones no alert is watching" (Superlog). It reads the GitHub repositories you choose to find the cause, and checks Linear, GitHub, Slack, and your alerts so it doesn't report problems you already track. What reaches you is one Slack message per problem, with the impact, the root cause, the evidence, and a suggested fix. Sazabi works from logs in a similar way and sends each issue with its root cause and a plan that engineers or coding agents can use to fix it. Both suit teams whose alerts don't cover every failure.
Investigation agents: Resolve AI, Cleric, Traversal, Causely, NeuBird, and Komodor. These take an alert, gather evidence across your telemetry, deploys, and code, and name a likely cause. Cleric also checks each change you ship, to catch regressions your tests missed (Cleric). Komodor does this work for Kubernetes. Cleric, Traversal, and Causely can also start on their own, from a change or a pattern in your telemetry. The others need an alert, so a problem nobody alerts on never reaches them.
Incident platforms: incident.io, Rootly, and PagerDuty. These already open incident channels, page people, and write postmortems. Their agents investigate inside that flow and post findings to the incident channel. If you already run incidents on one of them, its agent is the smallest change to how your team works.
Observability platform: Datadog. Bits Investigation reads Datadog's own metrics, traces, and logs, and third-party sources are still in preview. If your telemetry is already in Datadog, it works from that data without another integration.
Coding agent: Replicas. Replicas doesn't watch production. It starts a coding agent such as Claude Code or Codex when an alert, message, or webhook arrives, and the agent works in a full copy of your repository on its own cloud machine. It can run the code, reproduce the error, run the tests, and open a pull request. That makes it a good pair for a tool that finds or explains problems but leaves the code change to you.
Log analysis tools: search versus an agent that reads the logs
Most log analysis tools, such as Elasticsearch, Splunk, Grafana Loki, or Datadog Log Management, store and index your logs so you can search them, chart them, and alert on patterns you already know about. An AI log analysis tool reads the logs for you and reports what looks wrong.
| Search-and-dashboard log tools | AI log analysis | |
|---|---|---|
| What you do | Write queries, build dashboards, and define alerts | Connect your logs and read the findings |
| What the tool does | Stores, indexes, and searches logs | Groups errors, spots new patterns, and investigates them |
| What you get | Matching log lines and charts | A problem with its impact and a likely cause |
| What it can miss | Anything you didn't query or alert on | Problems the agent doesn't recognize or explains wrongly |
The two work together. Superlog, for example, reads logs from Datadog, Grafana, Sentry, and CloudWatch, so you can keep the log store you have and add an agent that reads it (Superlog). Either way, check an AI finding against the log lines it cites before you act on it.
From an alert to a fix PR: a Replicas run we did
We set up a Replicas automation in our own organization that turns an error alert into a pull request, and fed it a real bug. The code was Krause, a small basketball management game we keep for testing (Node.js, Express, and SQLite), with no customer data in it.
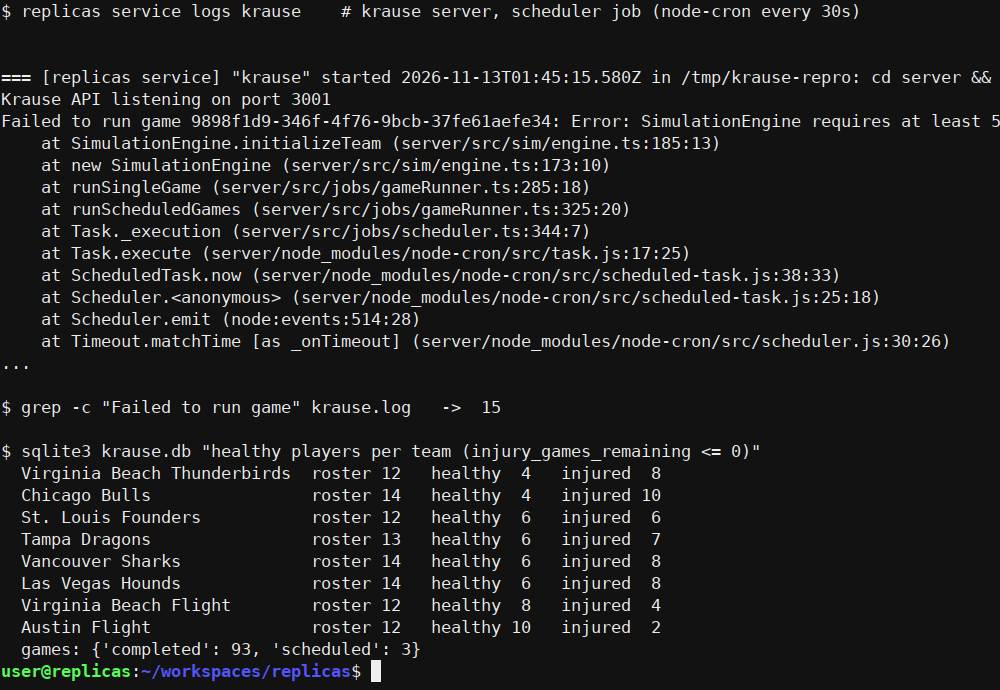
The bug. We ran a league on Krause's existing code and let the schedule play out. Injured players were never healing: the game set an injury's length but nothing counted it down. After enough games, one team had 4 healthy players out of 14, and every game it played crashed with SimulationEngine requires at least 5 active home players. Failed games stayed scheduled, so the job retried them and crashed again every 30 seconds.
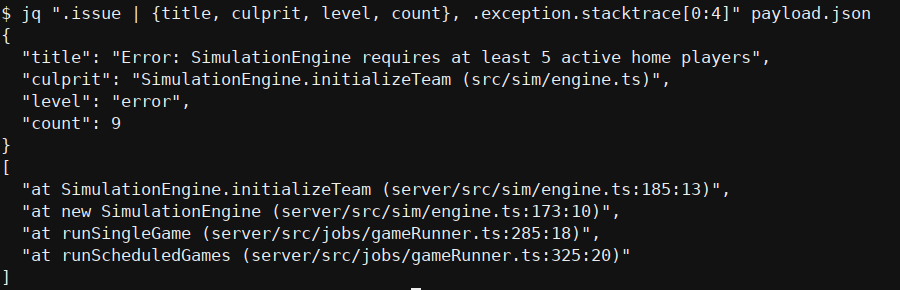
The alert. Our organization didn't have Sentry connected at the time, so instead of a Sentry trigger we used a custom webhook trigger. We sent it the error as a JSON payload shaped like a Sentry issue alert, with the real title, stack trace, and event count. A Sentry trigger puts its event payload into the agent's prompt in the same way, but we didn't test that route in this run.
The automation's prompt was one line: "Evaluate whether this error is valid. If it is, find the root cause, fix it, open a PR, and explain the error and the fix in the PR description." It ran Claude Code on Claude Opus 5.5, in a new cloud workspace with the repository checked out.
| Step | Time after the alert |
|---|---|
| Workspace created | 1 s |
| Agent got the prompt | 11 s |
| Agent named the cause: the injury counter is never decremented | 28 s |
| Agent reproduced the crash with its own script | 2 min 7 s |
| Pull request opened | 2 min 57 s |
The fix. The agent's pull request counts injuries down after every game. It also lets the least-injured players fill in when a team has fewer than five healthy players, so leagues that were already stuck could recover. Its description explained the cause, the fix, and how it tested it. It also pointed out a second problem that it left alone: any game that fails for another reason is still retried forever.
We checked the fix ourselves before trusting it. On a copy of the database that was crashing, the PR's branch finished all three stuck games on the first run, and the team went from 4 to 6 healthy players. A longer run finished 96 of 96 games with no failures.
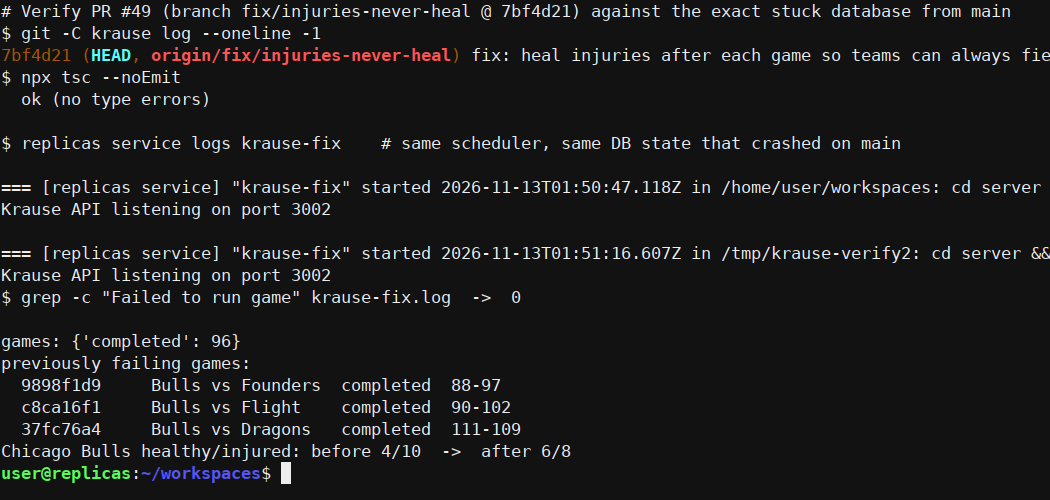
The pull request is still waiting for a person to review it. The fix lets injured players play at full strength, and whether that's acceptable is a call for a person. That's why the prompt asked for a pull request and not a merge. To set one up, connect Sentry and create an automation with a Sentry trigger, or point any alerting tool at a custom webhook.
How to pick
Start with where your team loses time:
- Problems go unnoticed until a customer reports them. Look at a log-first tool such as Superlog or Sazabi.
- Alerts fire, but working out the cause takes hours. Look at an investigation agent, or at the agent in the incident or observability platform you already use.
- Incidents are chaotic. Look at incident.io, Rootly, or PagerDuty first, then at their agents.
- You know the cause, but the fix waits in a queue. Send the alert or finding to a coding agent that can open the pull request.
You can also pair two of these, such as a tool that finds and explains the problem with a coding agent that writes the fix. Check how the finding gets from one to the other, and who approves the change.
FAQ